
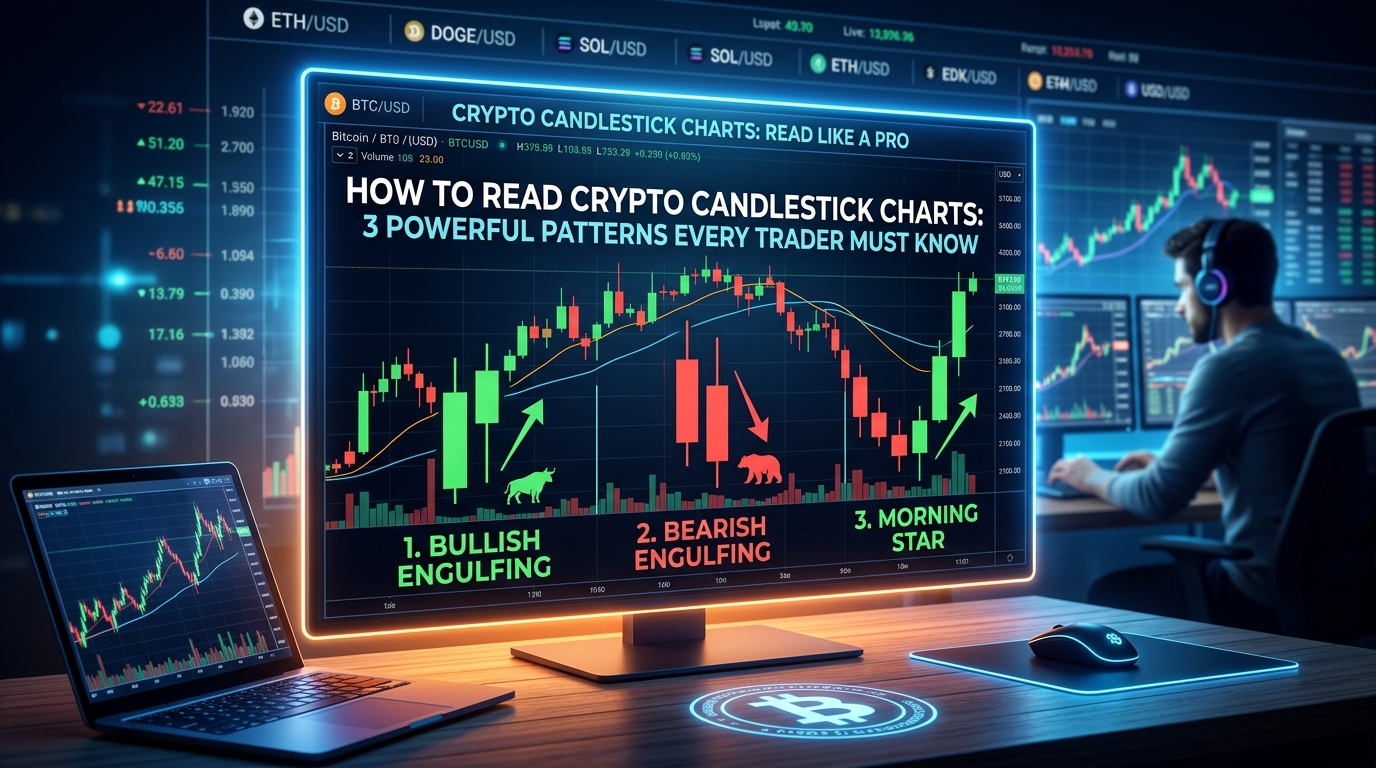
Open any crypto trading app and you will see it right away. Rows of little red and green bars, some tall, some tiny, some with thin lines poking out of the top and bottom.
To a beginner, it looks like a messy bar code. To an experienced trader, it looks like a story about fear, hope and greed.
That story is told through crypto candlestick charts, and the good news is that you can learn to read it much faster than you think.
In this guide, I will explain crypto candlestick charts in plain language, show you the 3 patterns worth learning first, and warn you about the mistakes that cost beginners money.
Why Every Crypto Trader Meets a Candle Sooner or Later
Price numbers alone do not tell you much. Knowing that a coin costs a certain amount is one thing. Knowing how it got there is another.
Did the price jump up smoothly? Did it crash and bounce back? Did buyers and sellers fight all day and end up in the same place?
Crypto candlestick charts answer these questions at a glance. Each candle packs four pieces of information into one small shape, so you see the whole battle between buyers and sellers, not just the final score.

That is why almost every trading platform uses them as the default view. Learn to read crypto candlestick charts and every chart on every exchange starts to make sense.
Anatomy of a Candle: Body, Wicks and Four Prices
Every candle is built from four prices for a chosen period of time:
- Open: the price at the start of the period
- High: the highest price reached
- Low: the lowest price reached
- Close: the price at the end of the period
The thick part of the candle is called the body. It shows the distance between the open and the close.
The thin lines above and below are called wicks, or shadows. They show how far the price travelled before pulling back.
Here is a simple way to picture it. The body is where most of the action finished. The wicks are the places the price visited but could not hold.
A long wick tells you something important. It means one side tried hard to push the price, and the other side pushed back.
Green, Red and Everything in Between
Color gives you the mood of a candle in one second.
- A green candle usually means the price closed higher than it opened. That is a bullish candle
- A red candle usually means the price closed lower than it opened. That is a bearish candle
Some platforms use other colors, or hollow and filled candles instead. Most let you change this in the settings, so always check what your own chart means before you start.
Size matters too. A long body shows strong pressure in one direction. A short body shows a quiet, balanced period.

Put color and size together and you can already read a lot. A tall green candle says buyers were in control. A tall red candle says sellers took over. A tiny candle says nobody was winning. That is the basic language of crypto candlestick charts.
Four Quick Candle Stories
Before we move on, let’s practice reading single candles like short stories. This habit makes crypto candlestick charts feel far less scary.
- Tall green body, tiny wicks: buyers controlled almost the whole period from open to close
- Tall red body, tiny wicks: sellers dominated from start to finish
- Small body, long upper wick: the price shot up, but sellers pushed it back down
- Small body, long lower wick: the price dropped, but buyers pulled it back up
See how each shape tells you who won the tug of war? Once you can read single candles, you can read groups of them. And groups of candles are what crypto candlestick charts are really made of.
How Crypto Candlestick Charts Differ From Stock Charts
If you have seen stock charts before, you may think crypto works the same way. Almost, but not quite.
Stock markets open and close at set hours. Crypto markets run 24 hours a day, seven days a week. There is no closing bell, so candles simply roll on without a break.
That brings a few differences:
- Many exchanges close daily candles at a fixed time based on UTC, so the same coin can look slightly different on different platforms
- Crypto prices can move fast, which often creates long wicks
- Thin trading on small coins can cause sharp spikes that fade quickly
So when you study crypto candlestick charts, treat very small coins with extra care. A dramatic candle on a low volume coin may say less than the same candle on a major one.
Choosing Your Timeframe
Crypto candlestick charts let you pick how much time each candle represents. It can be one minute, fifteen minutes, one hour, four hours, one day or one week.
Pick one minute and each candle shows what happened in sixty seconds. Pick one day and each candle shows a whole day of trading.
So which one is right for you?
- Short timeframes (1 to 15 minutes): fast and noisy, mostly used by very active traders
- Medium timeframes (1 to 4 hours): a balance between detail and calm
- Long timeframes (daily and weekly): slower, clearer and better for the big picture
Many traders believe signals on higher timeframes carry more weight than the same signal on a one minute chart. For beginners, the daily chart is a friendly place to start because it moves slowly enough to think.
From Rice Markets to Your Phone Screen
Here is a fun detail before we get to the patterns. Candlestick charts are older than Bitcoin, older than computers and even older than the modern stock market.
Their roots go back to 18th century Japan, where rice traders needed ways to track price swings. The trader most often linked with this story is Munehisa Homma, though historians still debate some of the details. According to a Nasdaq explainer, candlestick charting began in Japan and was later introduced to Western markets by the American analyst Steve Nison (source: Nasdaq).
Think about that for a moment. A tool built for rice is now used to read Bitcoin and thousands of other tokens.

Why has it lasted so long? Because human emotion has not changed. Fear and greed moved rice prices then, and they move crypto prices now. That is exactly what crypto candlestick charts help you see.
Pattern 1: The Doji, When the Market Cannot Decide
The doji is the easiest pattern to spot in crypto candlestick charts. It is a candle where the open and close are almost the same price, so the body is tiny or just a thin line.
It looks like a cross or a plus sign.
What does it mean? Indecision. Buyers pushed the price up, sellers pushed it down, and neither side won.
There are a few popular versions:
- Standard doji: wicks on both sides, a balanced fight
- Dragonfly doji: a long lower wick and almost no upper wick, which shows sellers pushed the price down but buyers brought it back
- Gravestone doji: a long upper wick and almost no lower wick, which shows buyers pushed up but sellers dragged it back
A doji on its own is not a trade signal. It is a pause, like a traffic light turning yellow. It tells you to pay attention.
The real clue comes from what happens next. If a doji appears after a long rise, the market may be getting tired. If it appears after a long fall, sellers may be running out of energy. Always wait for the next candle before drawing a conclusion.
Pattern 2: The Hammer, the Candle With a Long Tail
The hammer is one of the most famous shapes in crypto candlestick charts, and it is easy to recognize once you see it.
Here is what it looks like:
- A small body near the top of the candle
- A long lower wick, usually at least twice the length of the body
- Little or no upper wick
Picture the story behind it. Sellers pushed the price sharply lower during the period. Then buyers stepped in and pulled the price back up near where it started.
That is why the hammer often appears at the end of a downtrend. It hints that buyers are waking up.
Notice the word “hints.” A hammer is a clue, not a promise. Many traders wait for the next candle to close higher before they trust it.
One more tip. The same shape after a long rise is called a hanging man. It can warn that buyers are losing strength. The shape is identical, but the location tells you the story. That is why context matters more than the pattern itself.
Pattern 3: Bullish Engulfing, When Buyers Take the Wheel
The third pattern in crypto candlestick charts uses two candles instead of one.
First comes a small red candle. Then comes a larger green candle whose body completely covers the body of the red one. It “engulfs” it, which is how the pattern gets its name.
Why does this matter? Because it shows a sudden change of mood. Sellers were in charge, and then buyers arrived with enough force to erase the previous candle and more.
For this pattern to carry weight, look for these things:
- It should appear after a downtrend, not in the middle of a sideways market
- The green candle should be clearly larger than the red one
- Trading volume should be higher than usual
Now flip the picture. A bearish engulfing pattern is the mirror image. A small green candle is followed by a bigger red candle that covers it, usually after a rise. It can suggest sellers are taking over.
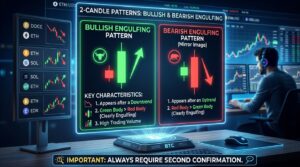
These two patterns are favorites among traders because they are simple and visual. But once again, treat them as a clue that needs a second opinion.
Sara Reads a Daily Chart
Imagine a trader named Sara who is reading crypto candlestick charts for a major coin that has been sliding for several weeks.
First, she spots a small candle with a long lower wick. It looks like a hammer. She does not rush in, because a hammer is only a clue.
The next day, a larger green candle appears and closes above the hammer, with more trading volume than usual. Now two signals agree. Sara takes a small position and places her stop loss just below the low of the hammer. If the price falls back under that level, she exits with a small loss.
Notice what she did right:
- She waited for confirmation
- She checked volume
- She kept the position small
- She planned her exit before entering
Sara is a made up example, but her habits are real. That calm routine is how careful traders use crypto candlestick charts. They do not chase excitement. They collect evidence first.
Reading Crypto Candlestick Charts Step by Step
Let’s put everything together into a simple routine for crypto candlestick charts that you can use on any chart:
- Start on a higher timeframe, like the daily chart, to see the overall direction
- Ask yourself if the price has been rising, falling or moving sideways
- Look at the latest candles. Are the bodies big or small? Are the wicks long?
- Check whether a pattern like a doji, hammer or engulfing candle has appeared
- Look at trading volume to see if the move has real energy behind it
- Wait for the next candle to confirm what you think you saw
- Decide in advance where you will exit if you are wrong

That last step is the one most beginners skip. Before you enter any trade, decide where you will get out if the market goes against you. A stop loss order can help with that.
Why Patterns Sometimes Fail
Here is the honest truth that many tutorials skip: no candle pattern works every time.
Markets are made of real people, and real people are unpredictable. A perfect hammer can be followed by another drop. A clean engulfing candle can be followed by nothing.
There are a few common reasons:
- Big news can overpower any chart signal
- Low volume can make patterns unreliable
- Patterns on tiny timeframes often turn out to be random noise
- Other traders may be reading the same chart and acting early
So think of crypto candlestick charts as a weather forecast, not a crystal ball. They help you judge the odds, but they never remove the risk.
Give Your Candles a Team: Volume and Key Levels
Smart traders rarely rely on a candle alone. They add two friends.
Volume shows how much trading took place. A pattern with high volume suggests more people believe the move. A pattern with low volume deserves more doubt.
Support and resistance are price areas where the price has stalled or bounced before. Support is a level where buyers have often stepped in. Resistance is a level where sellers have often pushed back.
Here is why this matters. A hammer near a support level tells a stronger story than a hammer floating in the middle of nowhere.
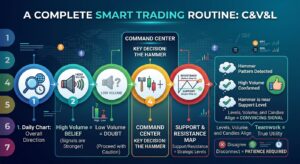
When candles, volume and levels all point in the same direction, the signal becomes more convincing. When they disagree, patience is usually the best move. That teamwork is what makes crypto candlestick charts truly useful.
Five Beginner Mistakes to Avoid
Almost every new trader makes some of these while learning crypto candlestick charts. Learn them early and save yourself money:
- Trading on a single candle. One shape is never enough
- Ignoring the trend. A pattern means different things in different situations
- Using tiny timeframes only. They are noisy and stressful
- Skipping the stop loss. Always know your exit before you enter
- Risking too much. Never trade money you cannot afford to lose
Most important of all, do not let a pretty pattern make you feel certain. Confidence is good. Overconfidence is expensive.
Practice Without Risking a Single Coin
The best way to learn crypto candlestick charts is to look at a lot of them.
Here is a simple practice plan:
- Open a daily chart of a major coin and scroll back through its history
- Find dojis, hammers and engulfing candles and see what happened next
- Write down your observations in a notebook
- Try a demo or paper trading mode if your platform offers one
Many charting platforms and some exchanges offer practice modes where you trade with pretend money. Use them. Mistakes are free there.
After a few weeks, you will start recognizing shapes without thinking. That is when the learning really starts to feel fun.
Where to Find Your Charts
You do not need special software to start. Most major exchanges show crypto candlestick charts on every trading page, and free charting platforms such as TradingView let you view them for thousands of coins. Make sure you are on the official website or app, because fake trading sites do exist.

When you open crypto candlestick charts for the first time, look for the timeframe menu, the volume bars at the bottom and the settings for candle colors. Spend a few minutes clicking around. Nothing breaks, and you will learn the controls quickly.
Common Questions About Crypto Candlestick Charts
Do I need to memorize dozens of patterns?
No. Start with the three in this guide. Understanding a few patterns well beats knowing many patterns badly.
Which timeframe should a beginner use?
The daily chart is a friendly start. It moves slowly and filters out a lot of noise.
Can candlestick patterns predict the future?
No. They show how buyers and sellers behaved, which helps you judge probabilities. That is all crypto candlestick charts can offer, and they never guarantee what comes next.
Are green candles always good news?
Not necessarily. A green candle only tells you the price closed higher than it opened in that period. The bigger context still matters.
Do crypto candlestick charts work for every coin?
They work best on coins with healthy trading volume. Very small coins can behave unpredictably, so be extra careful with them.
Final Thoughts: Learn to Read the Story
At first, crypto candlestick charts look like a wall of colors. But now you know the secret. Every candle is a tiny story with a beginning, a middle and an end.
Start with the basics. Learn the body and the wicks. Spot the doji, the hammer and the engulfing pattern. Always wait for confirmation, and always protect yourself with a plan.
Do that consistently, and crypto candlestick charts will stop feeling like confusing noise and start feeling like a language you actually speak.
This article is for education only and is not financial advice. Trading crypto is risky, so do your own research and never risk more than you can afford to lose.